Property reports are essential tools to enhance your services and stand out from the competition. By providing clients with detailed and informative reports, you can elevate their experience and position yourself as a knowledgeable and trusted advisor.
Some key benefits of Property Reports include:
- Informed Decision-Making: Empower clients with comprehensive property data.
- Enhanced Credibility: Demonstrate expertise and professionalism.
- Negotiation Advantage: Utilise data-driven insights for better negotiations.
- Effective Marketing: Highlight property features to attract buyers.
- Client Satisfaction: Build trust and loyalty through exceptional service.
Step 1: Property Search
To create a Property Report:
-
Navigate to the Create and Search page.
-
Use the search field to enter the property address. You can type a partial address or postal area to locate a property. [For guidance on area searches, click here.]
-
From the dropdown list, select the correct property.
Note: If you are integrated with Street.co.uk and have valuations assigned to your email address, they will automatically appear under Upcoming Valuations, allowing you to create a Property Report without having to search for the address. If they do not appear, please ensure that your Spectre username matches your Street username.
Once you have selected an address, it will present a property details card to the right of your screen. To proceed with creating a report, select ‘See more information’.
Step 2: Explore property information
You will be presented with all the data we host on the property you have selected. Explore this information to learn more about the property.
There are 3 main actions you can take from here:
- Return back to the map
- Search another property
- Create a report

Step 3: Create & Customise your report
Left hand edit panel
The first drop down enables you to choose which account you would like to create this report for. This will dictate the content on the account tab, and the branding used for the report. You will only see this option if you are a part of more than one account, otherwise it will default to your primary account.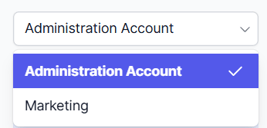
The second dropdown allows you to select a report template, which defines both the content and layout of the report. Several pre-built templates are available to help you quickly customise reports for various use cases. You can also create your own templates by modifying an existing one and saving it as a new template mid-journey — see further below for more details.

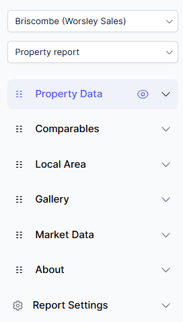
Once you select the dropdown, additional data points for customising the report's content and layout will appear. The icon on the left side of each data point allows you to drag and reorder their display on the report.
To edit the data points, scroll down the right side of the screen. Hover over the data point and a pencil icon will appear. Click this icon to access the editing options.

Property -
You can update the following sections under:
- Valuation Request
- Property Value
- Description
- Market History
- Build
- Property Size
- Plot Information
- Council Tax
- Tenure
- Flood Risk
- Mobile Coverage
- Broadband Speed
- EPC
- Planning Applications
- Listed Buildings
- Construction Materials
- Utilities
- Restrictions and rights
- Coastal Erosion
- Outdoor Space
- Tree Preservation Orders
- Air Traffic Noise
- Parking
- Radon Gas
Comparables
This page is split into three sections: Sales, Completed, and Lettings Comparables. To modify the range of properties included in the report, simply click on a property box to add or remove with relevance.To find more relevant comparables, use the 'Filters' option. This allows you to refine the selection based on criteria such as:
- Status
- Value
- Bedrooms
- Property Type
- Distance
- Time on Market
- Agent
To view all comparables in a section, click 'View selected.' From here, you can remove all properties or hover over the one you wish to delete and select 'Remove'.

To view the listing images, click on the first image of the property of your choice to scroll through all available photos. Alternatively, hover over the property block and click ‘More info’ in the top-right corner to access a detailed property comparison.

Click ‘Map View’ to see how close the properties are to the address used for the report.
Once you’ve finalised your selections, move on to the next comparables tab to repeat the process for the Completed and Lettings sections.
Local Area
To enhance your report, relevant local information tailored to your audience’s interests, such as details about ‘Education,’ ‘Transport,’ ‘Nearby Planning Applications,’ or ‘Nearby Listed Buildings' will be automatically included.
Select ‘Show List’ to view the data. Clicking an icon on the interactive map will display a brief overview of the selected option. To hide any data points, hover over the section on the left panel and click the eye icon.

Gallery
The gallery tab enables you to add your own photos and videos of the property to the report. If you have your Street and Spectre accounts integrated, you'll be able to pull the listing images directly.

Please note the following -
- Photos must be under 5MB.
- Videos must be hosted on YouTube or Vimeo.
- Virtual tours must be from Giraffe 360 or Matterport.
Market
The market tab includes sales and lettings market statistics for the local area -
-
Average house price changes in last 12 months
-
Average time on market
-
Volume of sold properties in the last 12 months
-
Average price per sqft
-
Average rental price changes in last 12 months
-
Average time on the rental market
-
Volume of properties that have let in the last 12 months
-
Average rental yield
About
The about tab auto pulls the following information from your settings -
- Branch bio
- Agent bio
- Video
- Testimonials
- Contact information
Report Settings
Scroll to the bottom of the left-hand panel to access the report settings. Here, you have the option to:
- Anonymise the address displayed in the report, which is helpful when sharing the report through public channels to protect the full address of your listing.
- Hide all sections without content, saving you the time of manually going through each tab.
- Remove contact details, choose whether to include agent specific contact details in your report.
Step 4: Save and Share Your Report
Finally, you have the option to save your edits, including any removed data points and the formatting of how they appear in your report, as a template for future use by clicking 'Save template as'. Once saved, the template will be available in the second dropdown menu.

When you are ready to finalise your report, click the ‘Save & Share’ button located in the top right corner of the page.
- The report will now save in your Property Reports page for future use
- You can personalise your report by clicking the plus icon -
- Add the recipient's name & a message which will be shown on the front cover
- Choose who your report is from, you can create reports behalf of your colleagues and sign the report off by them. This will include their bio on the about page. By default the report will be signed off by you unless changed.
- Choose to share your report:
- Digitally through a tracked link/QR code
- Digitally through a tracked link/QR code with a lead capture modal. Any recipient will need to provide their details to view the report.
- Create & download a PDF report
Please note, certain interactive features of the report will not be available on the Printable option.